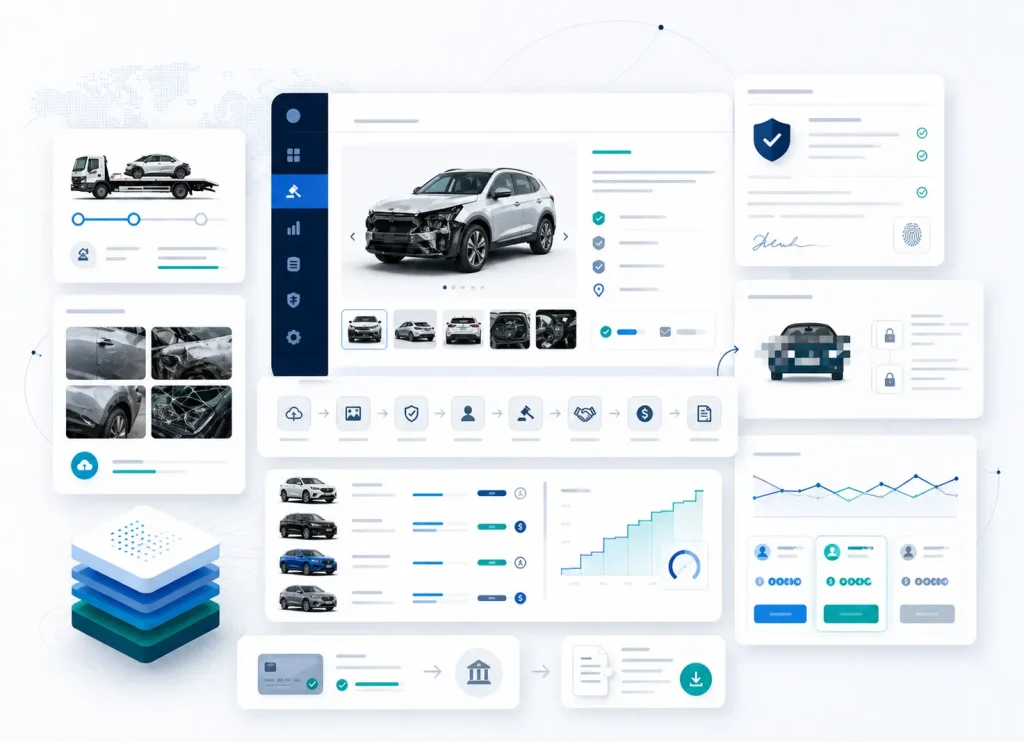
Insurance companies manage claims through multiple systems – salvage auctions, assessor task management, repair cost authorization, and more. Each system captures valuable data, but without a unified view, insurers struggle to understand overall performance, identify inefficiencies, and optimize costs.
We built a Business Intelligence hub that aggregates data from across the claims ecosystem, calculates KPIs, and delivers actionable insights through interactive dashboards and detailed reports. The platform gives insurers complete visibility into their claims operations.
The Challenge
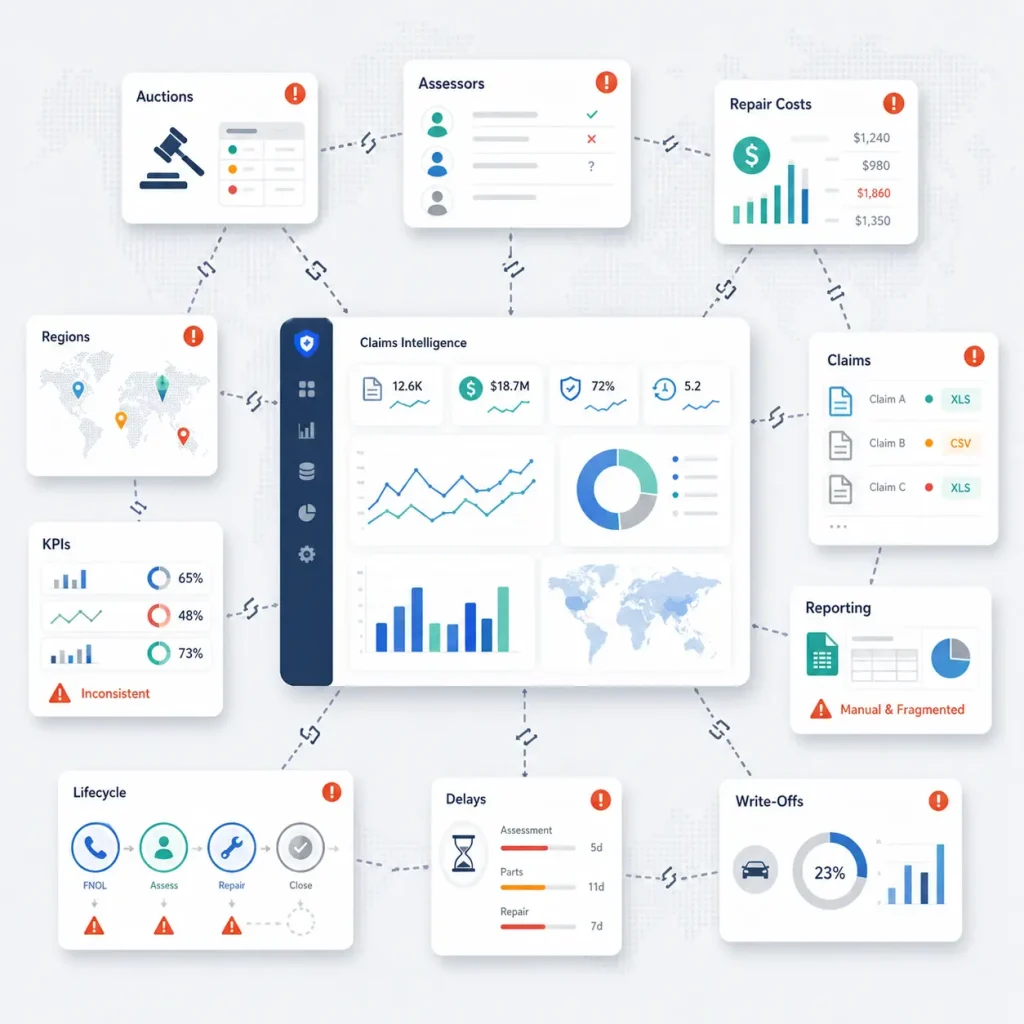
Insurance companies faced significant obstacles in understanding their claims performance:
- Data silos – information scattered across auction platforms, task management systems, repair authorization workflows, and external data feeds
- No unified metrics – different systems tracked different data points with no consolidated KPIs
- Limited visibility into lifecycle – difficult to track a claim from incident through inspection, repair decision, and final settlement
- Cost analysis gaps – understanding true costs (collection, storage, repair, salvage recovery) required manual data gathering
- No trend identification – without aggregated data, spotting patterns by vehicle make, region, or claim type was impossible
- Reporting burden – generating management reports required extensive manual work and spreadsheet manipulation
What We Did
We designed and built a comprehensive BI platform that consolidates data from multiple sources and delivers insights across several key dimensions:
Data Integration Layer
- Integration with external data feeds (assessor systems, repair networks)
- Connection to internal platforms: salvage auction system, task management, repair cost authorization
- Automated pre-accident valuation (PAV) calculations
- Real-time data aggregation and KPI computation
Claim Lifecycle Analytics
Complete visibility from first notice to settlement:
- Instruction to inspection timing
- Inspection to report delivery
- Estimate to final cost comparison
- PAV agreement to claim settlement
- Total cycle time analysis by claim type
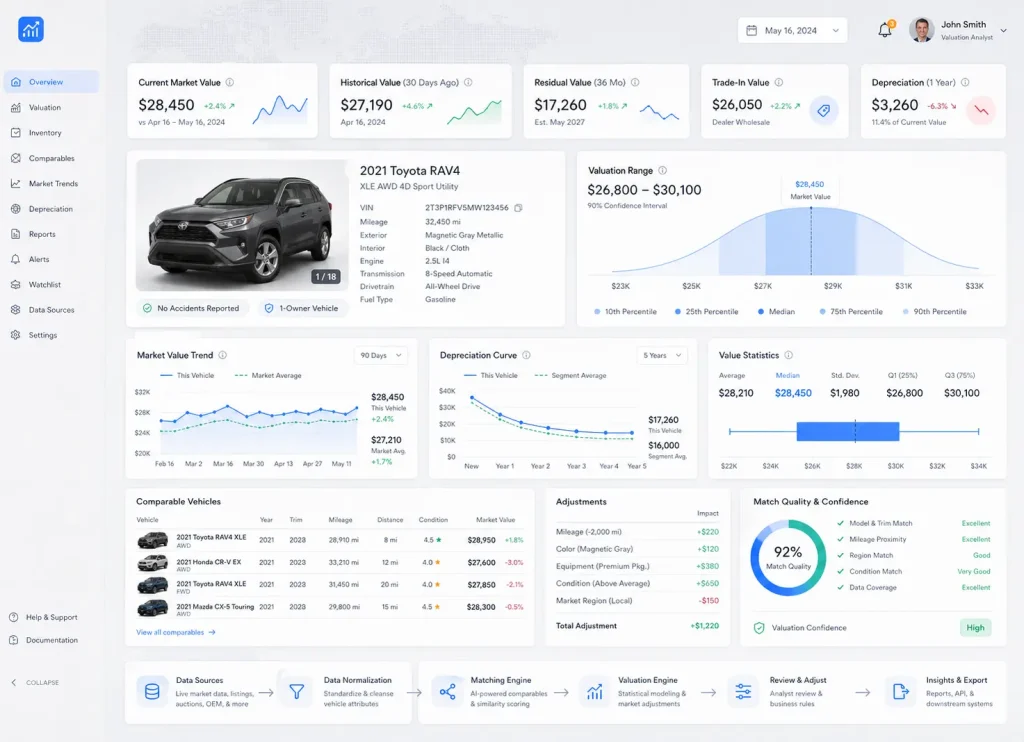
Metrics include:
- Repair vs. total loss ratios
- Write-off category distribution
- Cost breakdown by component (labor, parts, paint)
- Average repair cost by vehicle make, region, and claim type
- Average PAV by make, region, and loss category
- Vehicle age analysis for repaired vs. written-off vehicles
- Claims distribution by fuel type
Salvage Performance Analytics
Auction and recovery insights:
- Salvage return rates by write-off category
- Engineering PAV vs. actual auction value comparison
- Average auction price and bid counts
- Listing views and auction duration
- Recovery rate optimization metrics
Engineering Cycle Time Analysis
Assessor and inspection performance:
- Time from incident to first contact
- Instruction to inspection duration
- Physical vs. desktop inspection comparison
- Report delivery timelines
- Estimate accuracy (initial vs. final costs)
Collection & Storage Analytics
Logistics cost tracking:
- Collection lifecycle from incident to vehicle pickup
- Average collection and storage costs
- Time-to-collection metrics
- Cost optimization opportunities
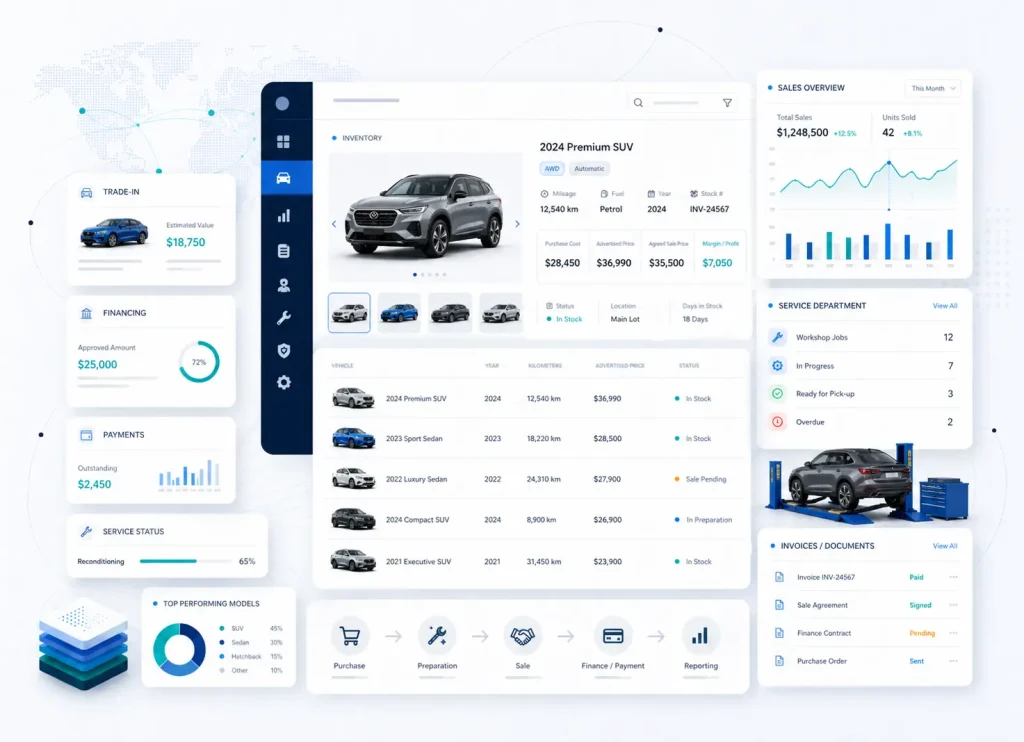
Reporting & Export
- Interactive dashboards with drill-down capabilities
- Visual charts and trend graphs
- Full data export to Excel
- Breakdowns by region, vehicle make, vendor, assessor
- Aggregate KPIs with detailed record-level data

The Results
- Unified data view - all claims systems consolidated into single BI platform
- Complete lifecycle tracking - visibility from incident through settlement
- Real-time KPIs - key metrics calculated and updated automatically
- Cost transparency - full breakdown of repair, collection, storage, and recovery costs
- Performance benchmarking - comparisons by region, vehicle make, assessor, and vendor
- Trend identification - patterns visible across thousands of claims
- Cycle time optimization - bottlenecks identified in claims processing
- Data-driven decisions - management reports generated in minutes, not days
Technologies Used
Let's Start the Conversation
Tell us about your challenge. We’ll share relevant experience and outline a practical path forward.